Create Your First Project
Start adding your projects to your portfolio. Click on "Manage Projects" to get started


Box Office Movies Sales Regression Analysis
Project Type
Data Analysis using Excel
Date
April 2023
Report
BOX OFFICE DATA ANALYSIS REPORT
Contents:
1. Summary
2. Data Processing
3. Finalizing dependent and independent variables
4. Assumption of relationships between dependent and independent variables
5. Exploratory analysis
6. Running of Multiple Regression Analysis
7. Interpretation of Result
SUMMARY:
This project is to report on the box office data analysis, where multiple regression analysis is performed on movie review and its box office data to understand what factors can impact the sales of box office with help of Data Analysis tool pak of Excel.
The main findings is to determine how factors such as genre, number of pictures and trailers on imdb, award, reviews make either positive or negative impact and also determine their significance of impact on the box office sales. The final findings are included in the result interpretation module.
DATA PROCESSING
Initially , as part of the project , there were two files given namely movie_review _data and box_office_data which had two columns in common which were ‘movie_id’ and ‘date’ where data represents movie review and box office data collection dates. The main goal was to merge these two files as one of them had all the independent variables or factors which would impact the box office sales .
Merging of both files using composite key
Initially date columns format is different in two files so both columns are bought into same format with help of text() function of excel. Using DateValue() method, a numeric key for date is created and incremented by 1.
The movie reviews atleast take 1 day time or time lag from that of the box office data hence this time lag column of date is created and After that, to create composite key, with help of concate() function movie id and this new date are concatenated and a composite key is formed in both the files and with help of VLOOKUP both the data is merged.
Removing of redundant/null values
After merging the files , data is checked for null or unnecessary values by filtering each columns and have been filtered out and after these steps of data merging, data cleaning the new data is jotted to a total of 3011 records from 6066 . Hence, 3011 records/observations have been considered for regression analysis
Thus nulls,NAs or blanks are all dropped.
FINALIZING DEPENDENT AND INDEPENDENT VARIABLES
Creation of independent and dependent variables
Now, independent and dependent variables have been segregated. Few of the independent variables are explicitly created by using log transform, higher degree variant of a particular independent, and dummy variables for categorical factors are created.
Our dependent variable here is box_office which indicates performance/sales of box_office in $1000, I created sales column which multiples and takes box_office sales in terms of 1000 dollars.
Categorical variables are converted into its numeric equivalent or dummy variables so that they can be part of the regression analysis. For award categorical variable which has only two values yes or no, using IF() condition I have created another column with binary values such that when award is yes, isaward column stores as 1, when award is yes and when award is no, it stores value as 0.
Similarly for ‘Genre 1’ , there are 9 categories so 9-1 = 8 indicator dummy variables for different genres present in genre1 are created as follows action,animation,children,comedy,drama,fantasy,romance,suspense and if the movie doesn’t fall to any of these 8 categories it automatically comes into 9th category which is thriller. That is for the 9 category variable ‘genre1’, 8 dummy variables are created.
Note : Genre 2 and Genre3 can also impact the sales but due to time and feasibility constraints, it is not considered as part of the regression analysis.
Let me list down the variables used in the regression analysis
Independent variables :
1. Isaward,
2. trailer,
3. length
4. tickets
5. screens
6. pictures
7. word_of_mouth(reviews)
8. word_of_mouth_sq
9. overall_rating
10. rating
11. action
12. animation
13. children
14. comedy
15. drama
16. fantasy
17. romance
18. suspense
In these independent variables we can word_of_mouth measure which is nothing but reviews, overall_rating and rating which is log transformed overall_rating which contribute towards movie reviews. We will see why the log transform has been taken.
We also have word_of_mouth_sq which is a second order variant of word_of_mouth , and the reason to take higher order variant.
Dependent variable :
Sales
EXPECTATION OR ASSUMPTION OF RELATIONSHIPS BETWEEN INDEPENDENT AND DEPENDENT VARIABLES
Now we will check the relationship expected between other variables that can have impact on sales
• Awards should have mostly positive impact on sales, but not necessarily as sometimes most award-winning movies may be boring and non-entertaining and may not have much significance on sales
• Number of trailers is expected to be significant and have negative impact as too many trailers can become spoilers leading to leakage of storyline or twists which can reduce enthusiasm among viewers causing less sales
• Length of the movie is mostly going to have positive impact as length can keep viewers intrigued but we also have to check that sometimes length can become disadvantage so second order or log transform can be checked to explore much more efficiently
• Tickets price can increase sales if the movie has more hype and increase in ticket price will have significant impact on sales
• No of screens will also increase the sales even if ticket prices go down, but more screens will help balance it and increase box office sales
• Number of pictures or posters can create interest and leads to increase sales
• Genre can have impact but not necessarily significant .
EXPLORATORY DATA ANALYSIS
The need for taking squared terms is that its not always true that longer reviews are better. Sometimes they may have unnecessary information or it becomes hard to read if it has meaningless information. Too short reviews also cannot help determining necessary factors
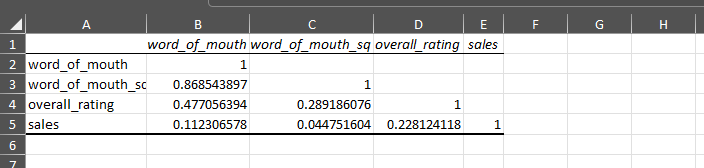
This Exploratory data analysis, where correlation matrix to understand relationship between sales and word of mouth(reviews) and ratings has been generated with a scatter plot where reviews(word_of_mouth) and box office sales(sales) is plotted. There we can see an inverse U shape (very slight bent or inverse U shape is observed due to wide range scale), which shows that reviews don’t always cause positive impact.
To detect such a relationship, a second order of the original independent variable is taken, and a polynomial regression is done with order 2. which is stored in column word_of_mouth_sq .
if we see the multiple regression analysis done with worth_of_mouth and word_of_mouth_sq have positive and negative coefficients which shows inverse relationship. Also, the p value is of not much statistical significance, which means word of mouth alone does not impact sales and there shall be other factors impacting sales.
The worth of mouth impact can be interpreted as on average, holding all other factors fixed, reviews with very few words or too many words are less likely to increase sales, while reviews with a moderate number of words are more likely to obtain gain in sales
Note : All final interpretations are stated in the last module
To understand reviews individual impact without other factors, I performed few simple linear regressions. Since p values do not show significance which means there is some underlying nonlinear relationships to be handled to meet the general expectation
SIMPLE LINEAR REGRESSIONS with factors assuming to impact sales
word_of_mouth(reviews) vs sales
Word of mouth or reviews has statistical significance and positive impact but when considered with other factors such as overall rating, it does not make significant impact on sales (since p value becomes greater than 0.05) which means there are other variables causing more impact of significance
Overall_rating and sales
Simple regression shows overall rating has positive coefficients and significance( p value<0.05) which means as rating increasing, sales increases. To interpret it properly, it means:
But overall rating gave negative coefficient when multiple factors were considered in regression, and when correlation matrix was checked, it had high correlation with trailer and pictures which impacted the result and log transform was applied and rating column was created to handle collinearity issue.
Now we see rating has positive impact, but it is not of much significance, when other factors are present
Award vs sales
There is significant positive increase in sales when the movie has awards.
Trailer vs sales
In multiple regression
If we observe the collinearity of trailer with overall rating, pictures,length is high which caused positive impact when simple regression is applied and negative impact when multiple. Such variables can be dropped but during multi regression the relationship between number of trailers and sales matched my expectation or assumption hence I am considering it. Such issues in data can be handled with better exploration of data and using other datascience models. For given timing and constraints this is my regression analysis on box office data
FINAL REGRESSION MODEL AND FINDINGS
Awards, ratings and reviews have less significant impact on sales when compared to the number of pictures, though they can have an increase in sales (positive coefficients). Number of pictures, Trailers posted on IMDB, Number of tickets, screens and length are the factors which have high significance in impacting the box office sales.
Individually awards, ratings and reviews have higher significance
Genre doesn’t have much significance, as we can see in the regression that animation movies have higher impact on sales then comes action followed by fantasy, comedy. Since the p value is greater than 0.05, that means here genre doesn’t make significant impact when other factors are present
Significant factors interpretations
1. Trailer : Holding all other factors fixed, on average, if we increase the number of trailers by one unit(1 in count )the box office sales will decrease by 306$ on average for that day
2. Length : Holding all other factors fixed, on average, if we increase the length of movie by one minute ,the box office sales will increase by 137$ on average for that day
3. Tickets : Holding all other factors fixed, on average, if we increase the tickets price by one unit(dollar) the box office sales will increase by 852$ on average for that day
4. Pictures : Holding all other factors fixed, on average, if we increase the number of pictures by one in count the box office sales will increase by 1.85$ on average for that day
5. Screens : Holding all other factors fixed, on average, if we increase the number of screens by one unit (in count) the box office sales will increase by 5.98 $ on average for that day
Less significant factors interpretation
6. Reviews (word_of_mouth and word_of_mouth_sq) : on average, holding all other factors fixed, reviews with very few words or too many words are less likely to increase sales, while reviews with a moderate number of words are more likely to obtain gain in sales
7. Rating (overall_rating on which log is performed, rating) : Holding all other factors fixed, on average, if we increase the rating by 100%, the box office sales will increase by 2131$ on average for that day ( 2.62 in 1000$(if we do not multiply box_office with its unit)
8. Award(isaward) : On average, holding all other factors fixed, movies with awards have an increase of 191$ in saleson average on that day.
9. Animation (one of the Genre 1) : On average, holding all other factors fixed, movies with animation genre have an increase of 2393$ in sales on average on that day.
Though few variables had collinearity or non linear relationships, its tried to best to resolve it through log transform and higher degree term of original variable, yet I still considered few of those variables as they matched my expectations /assumption.
For given timing and constraints this is my regression analysis on box office data
Venkata Gayathri Peri
BUS ADM 813 Final Project Report
Link
The BOX OFFICE DATA REGRESSION ANALYSIS project involved performing multiple regression analysis using excel analysis pack to compare various input and output variables and determining which input factors impact movie sales. This project showcases the ability to analyze and interpret complex data to understand factors affecting box office success in the film industry.