top of page
Create Your First Project
Start adding your projects to your portfolio. Click on "Manage Projects" to get started
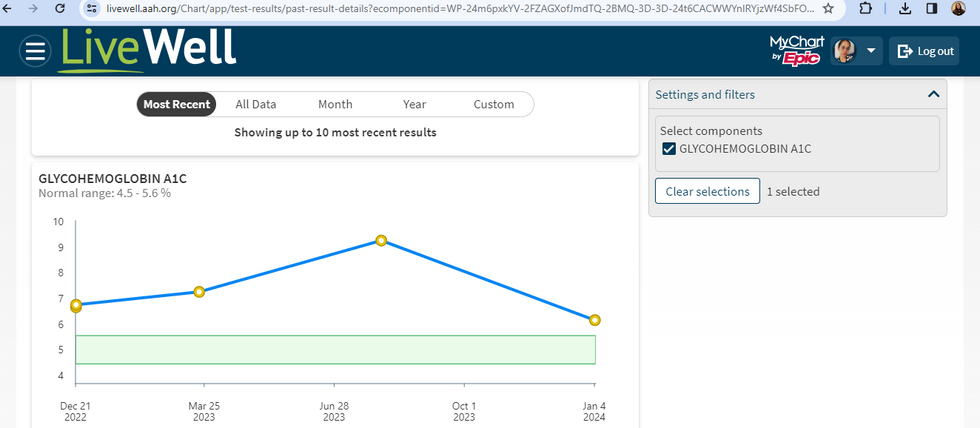
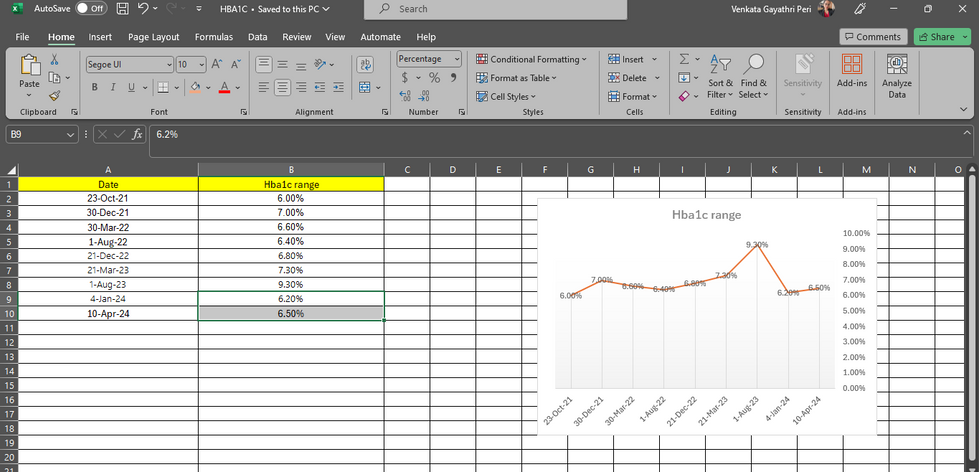
Blood glucose levels line chart
Project Type
Data Visualization
Date
April 2023
Introducing Visualizing My Average Blood Glucose-HBA1C, a recent project that aims to showcase a line plot replicating data from Livewell, Aurora's medical website empowered by Epic MyChart, using Excel.
I started this off as a first play around to explore excel's visualization capabilities and want to further visualize using Tableau or Power BI, incorporating personal fasting and postprandial sugar level , complete consolidated dataset for a more comprehensive visual representation.


bottom of page


